
Full-funnel attribution models distribute conversion credit across every recorded touchpoint in the buyer journey – from first-touch to algorithmic data-driven – using rule-based formulas or machine learning to answer which channels actually drove revenue. Single-touch models (first-touch, last-touch) assign 100% credit to one interaction and systematically misattribute conversions in over 60% of multi-step paths, while multi-touch and algorithmic models apply weighted or dynamic credit distribution across the entire funnel. Selecting the wrong attribution model does not just skew your reporting – it actively misdirects budget, defunds high-performing awareness channels, and inflates the apparent ROI of low-funnel conversion assists.
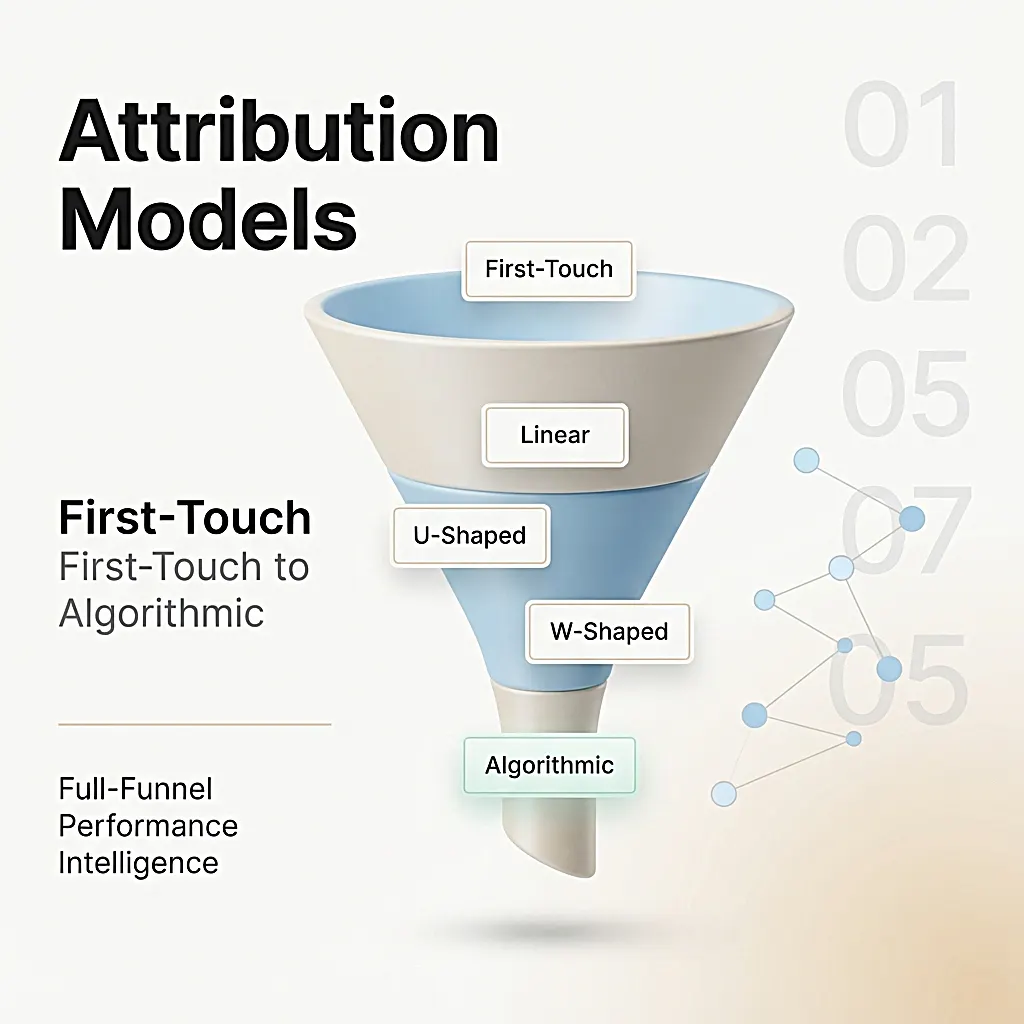
If your marketing team is running budget decisions on first-touch or last-touch data, you are almost certainly funding the wrong programs. Attribution is not a reporting formality – it is the operating logic behind every dollar you allocate across paid search, social, content, email, and events.
This article breaks down every major full-funnel attribution model with honest assessments, side-by-side comparisons, and real data so you can choose the right model for your funnel stage, sales cycle, and business goals.
For companies managing complex, multi-channel buyer journeys, partnering with a full-funnel revenue marketing intelligence solution ensures your attribution framework is aligned with actual pipeline outcomes – not just last-click vanity metrics.
What Are Full-Funnel Attribution Models? (Quick Definition)
A full-funnel attribution model is a framework that assigns credit for a conversion across every marketing and sales touchpoint a buyer encountered on the path to purchase. Instead of crediting a single interaction, full-funnel attribution treats the buyer journey as an interconnected sequence – from the first brand exposure at the top of the funnel through nurture touchpoints in the middle, down to the conversion event at the bottom.
Key components of any attribution model:
- Touchpoints: Every recorded interaction – ad clicks, email opens, content downloads, webinar registrations, demo requests
- Conversion event: The defined outcome being measured (lead, MQL, SQL, opportunity, closed-won deal)
- Credit rules: The formula that determines how much revenue or pipeline credit each touchpoint receives
- Attribution window: The time period within which touchpoints are counted
According to research published by arcalea.com, 72% of marketing teams identify attribution as their top measurement challenge – yet only 29% have deployed data-driven attribution models.
The 7 Core Full-Funnel Attribution Models Explained
1. First-Touch Attribution
How it works: Assigns 100% of conversion credit to the very first touchpoint in the buyer journey – the channel, campaign, or content piece that introduced the prospect to your brand.
Credit distribution: 100% to touchpoint #1, 0% to everything else.
Best for:
- Measuring top-of-funnel awareness channel effectiveness
- Identifying which channels generate net-new brand exposure
- Short sales cycles with 1-3 touchpoints
Where it breaks down: In B2B sales cycles averaging 8 to 15 touchpoints over 12 to 18 months, giving 100% credit to the introductory touchpoint produces a distorted view. A LinkedIn ad someone clicked 14 months ago receives full credit for a $200,000 deal – while the 12 nurture emails, two webinars, and a sales demo that actually drove the decision receive nothing.
Real example: A SaaS company running first-touch attribution sees paid social as its #1 revenue driver. They double the paid social budget. Conversion rates drop. The reason: paid social was generating awareness, but the bottom-of-funnel email sequences closing deals were defunded because they received zero attribution credit.
Ad
Post
×6
Search
Form
closing touchpoints.
Ad
Post
×6
Search
Form
Defunds demand generation.
2. Last-Touch Attribution
How it works: Assigns 100% of conversion credit to the final touchpoint before the defined conversion event – typically a demo request, form submission, or closed-won opportunity.
Credit distribution: 0% to all prior touchpoints, 100% to the last recorded interaction.
Why it’s the most common model: It is the easiest model to configure in any CRM, and the conversion event is the most obvious point to credit.
Why it is the most misleading model for full-funnel analysis:
Last-touch systematically over-credits bottom-of-funnel channels (branded search, retargeting ads, direct traffic, email) and under-credits every awareness and consideration program that built demand in the first place. If you consistently see branded Google Search as your top revenue channel under last-touch, it does not mean branded search is generating demand – it means buyers are googling your name after being converted by content, social, and events that received zero credit.
Real data: Single-touch models misattribute conversions in over 60% of multi-step buyer paths, according to attribution benchmark data from 2026.
3. Linear Attribution
How it works: Distributes conversion credit equally across every recorded touchpoint in the buyer journey. If a prospect touches 5 channels before converting, each receives 20% of the credit.
Credit distribution: Equal weight to all touchpoints (100% / total touchpoints).
| Touchpoints in Journey | Credit Per Touchpoint |
|---|---|
| 2 touchpoints | 50% each |
| 4 touchpoints | 25% each |
| 6 touchpoints | ~16.7% each |
| 10 touchpoints | 10% each |
Best for:
- Multi-channel DTC (direct-to-consumer) funnels
- Teams that need a balanced starting point before adopting more sophisticated models
- Campaigns where every touchpoint carries roughly equal strategic weight
Limitation: Linear attribution treats a $5 display impression and a 60-minute product demo as equivalent contributors. It is fairer than single-touch models but still lacks strategic weighting.
4. Time-Decay Attribution
How it works: Assigns exponentially more credit to touchpoints that occurred closer to the conversion event, using a decay function (commonly a 7-day half-life). Touchpoints further back in the journey receive progressively less credit.
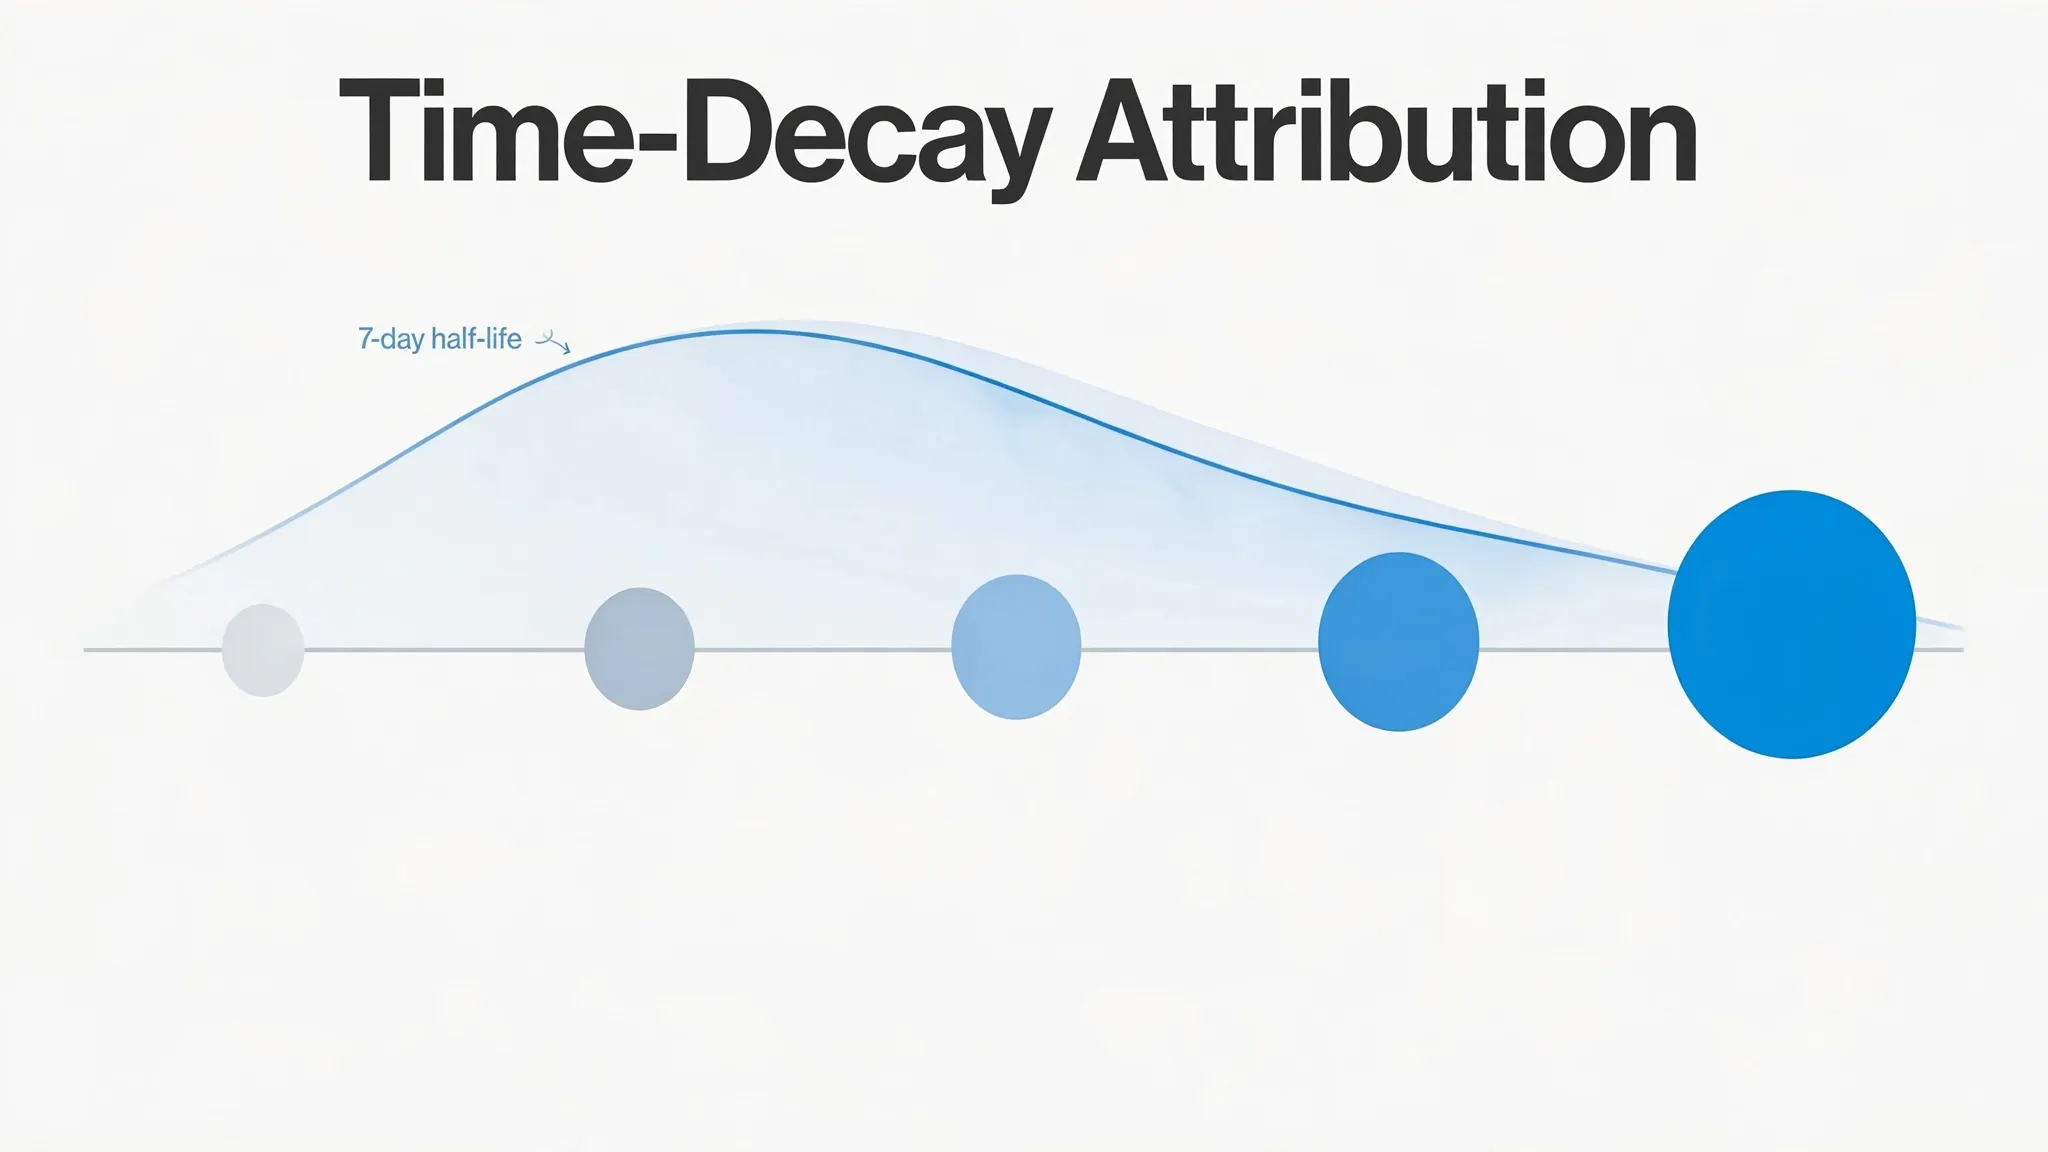
Credit distribution: Weighted by recency – highest credit to the touchpoint immediately before conversion, diminishing credit as you move further back in time.
Best for:
- Short sales cycles (under 30 days)
- E-commerce and subscription models
- Campaigns built around promotional windows, flash sales, or seasonal events
- Scenarios where recency of engagement genuinely predicts purchase intent
Where it breaks down: In long B2B sales cycles, time-decay penalizes the awareness and nurture touchpoints that did the heavy lifting months earlier. A thought leadership article that generated the initial intent 10 months ago receives near-zero credit – despite being the reason the prospect entered your pipeline at all.
5. U-Shaped (Position-Based) Attribution
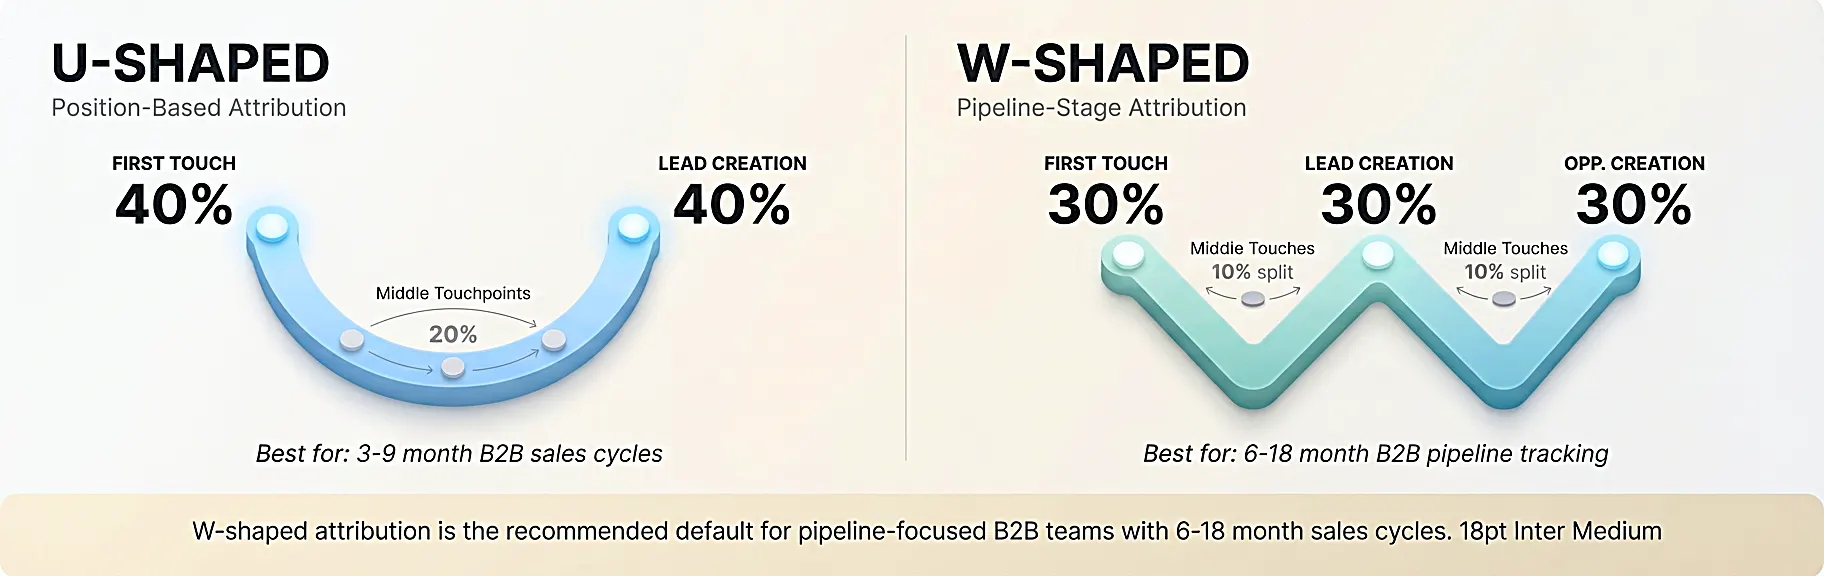
How it works: Assigns disproportionately high credit to the two most strategically significant touchpoints – the first interaction (brand discovery) and the last interaction before conversion (lead creation) – and distributes the remaining credit evenly across middle-funnel touchpoints.
Credit distribution:
- First touchpoint: 40%
- Lead creation touchpoint: 40%
- All middle touchpoints combined: 20% (split evenly)
Best for:
- B2B demand generation teams focused on measuring awareness and conversion efficiency simultaneously
- Organizations that track MQL conversion as a key pipeline milestone
- Sales cycles of 3 to 9 months with clearly defined lead generation events
Why marketers prefer U-shaped: It acknowledges both ends of the funnel without completely ignoring the middle, making it a practical upgrade from single-touch models for most mid-market B2B teams.
6. W-Shaped Attribution
How it works: Extends U-shaped attribution by adding a third high-weight milestone – opportunity creation (when a lead becomes a qualified sales opportunity). Credit is distributed across three anchor points with the remainder split across all other touchpoints.
Credit distribution:
- First touchpoint: 30%
- Lead creation touchpoint: 30%
- Opportunity creation touchpoint: 30%
- All other middle touchpoints: 10% (split evenly)
Best for:
- Pipeline-focused B2B teams with 6 to 18-month sales cycles
- Organizations tracking revenue attribution from lead to closed-won
- Marketing and sales alignment initiatives where both MQL and SQL milestones matter
- SaaS, enterprise software, professional services, and financial services
According to benchmark data from hyphadev.io, W-shaped attribution is the most practical default model for pipeline-focused B2B teams with sales cycles over 6 months.
7. Algorithmic (Data-Driven) Attribution
How it works: Uses machine learning algorithms – typically Shapley value analysis, Markov chain modeling, or logistic regression – to analyze historical conversion data and assign credit dynamically based on each touchpoint’s actual incremental contribution to conversion.
Unlike rule-based models (first-touch through W-shaped), algorithmic attribution does not apply a fixed formula. It learns from your actual data and updates credit assignments as patterns change.
Key algorithmic approaches:
- Shapley Value: Borrowed from game theory, it calculates each touchpoint’s marginal contribution by comparing conversion rates with and without that touchpoint present
- Markov Chain: Models the buyer journey as a sequence of states and calculates the probability that removing any given touchpoint reduces conversion rates
- Logistic Regression: Uses statistical modeling to weight touchpoints based on their predictive relationship with conversion outcomes
Best for:
- Enterprise B2B and B2C organizations with high conversion volumes (minimum 1,000+ conversions per month for statistical reliability)
- Teams with clean, unified data across CRM, marketing automation, ad platforms, and analytics
- Organizations that have outgrown rule-based models and need provably accurate budget allocation
Real performance data: Advanced algorithmic models improve ROI by 20% to 30% compared to traditional first-touch or last-touch attribution, according to machine learning attribution research published by madgicx.com.
Minimum data requirements for reliable algorithmic attribution:
- At minimum 1,000 monthly conversions
- Consistent UTM tracking and CRM hygiene across all channels
- Unified data layer connecting ad platforms, CRM, and analytics
- At least 90 days of historical conversion data
Full-Funnel Attribution Models: Side-by-Side Comparison Table
| Attribution Model | Credit Logic | Best Funnel Stage | Ideal Sales Cycle | Data Requirement | Accuracy Level |
|---|---|---|---|---|---|
| First-Touch | 100% to first touchpoint | Top-of-funnel (TOFU) | Under 30 days | Low | Low |
| Last-Touch | 100% to last touchpoint | Bottom-of-funnel (BOFU) | Under 30 days | Low | Low |
| Linear | Equal credit to all touches | Full-funnel | Any | Low | Medium |
| Time-Decay | More credit to recent touches | BOFU / short cycle | Under 60 days | Low | Medium |
| U-Shaped | 40% first, 40% last, 20% middle | TOFU + BOFU | 3-9 months | Medium | Medium-High |
| W-Shaped | 30% first, 30% lead, 30% opp | Full pipeline | 6-18 months | Medium | High |
| Algorithmic | ML-driven dynamic weighting | Full-funnel | Any (data-dependent) | High | Highest |
Choosing the Right Attribution Model: A Decision Framework
The model you choose should match three variables: your sales cycle length, your conversion volume, and your primary business objective.
Use this decision framework:
- Sales cycle under 30 days with low touchpoint count: Last-touch or time-decay attribution provides sufficient directional accuracy
- Sales cycle 30-90 days with multiple channels: Linear or U-shaped attribution balances fairness across the funnel
- Sales cycle 6-18 months with pipeline tracking: W-shaped attribution aligns with how B2B buying committees actually progress
- High conversion volume and clean data infrastructure: Algorithmic attribution delivers the most accurate ROI signals
- Awareness-only campaigns or channel testing: First-touch attribution isolates which channels generate net-new brand exposure
Questions to ask before selecting a model:
- How many touchpoints does the average buyer encounter before converting?
- Are you optimizing for pipeline generation or closed-won revenue?
- Do you have unified data across ad platforms, CRM, and analytics?
- What is your monthly conversion volume?
- Is your primary attribution goal budget allocation, channel performance reporting, or executive ROI proof?
Real Data: What Happens When You Switch Attribution Models
The same conversion data produces dramatically different channel performance rankings depending on which model you apply. This is not a reporting edge case – it is the central challenge of attribution.
Scenario: A B2B SaaS company with a 9-month average sales cycle
Touchpoints in a representative closed-won deal:
- LinkedIn Sponsored Content (month 1)
- Organic blog article (month 2)
- Webinar registration (month 4)
- Email nurture sequence – 6 emails (months 4-7)
- Google branded search click (month 9)
- Demo request form (month 9)
What each model tells you:
| Model | Organic Blog | Webinar | Email Nurture | Branded Search | Demo Form | |
|---|---|---|---|---|---|---|
| First-Touch | 100% | 0% | 0% | 0% | 0% | 0% |
| Last-Touch | 0% | 0% | 0% | 0% | 100% | 0% |
| Linear | 11.1% | 11.1% | 11.1% | 66.6% (×6) | 11.1% | 0% |
| Time-Decay | ~2% | ~4% | ~8% | ~30% | ~28% | ~28% |
| U-Shaped | 40% | 0% | 0% | 20% | 0% | 40% |
| W-Shaped | 30% | 0% | 0% | 10% | 0% | 30% + 30% (opp) |
| Algorithmic | ~18% | ~12% | ~20% | ~32% | ~8% | ~10% |
The critical insight: Under last-touch, branded search appears to drive 100% of revenue – so you increase the branded search budget. Under algorithmic attribution, the webinar and email nurture sequences show the highest actual incremental contribution – so you invest there instead. These are opposite budget decisions from the same underlying data.
Common Attribution Mistakes That Drain Marketing Budgets
Mistake 1: Relying on Platform-Level Attribution
Every ad platform – Meta, Google, LinkedIn – uses its own attribution logic and claims credit for any conversion that occurred within its attribution window. A buyer who saw a Meta ad, clicked a Google ad, and then converted via direct will be claimed as a conversion by both Meta and Google. This double-counting is not a data glitch – it is structural. Your cross-channel attribution must live in a neutral, CRM-connected system, not inside any individual ad platform.
Mistake 2: Choosing the Model That Makes Marketing Look Best
Attribution model selection is often driven by political convenience rather than analytical rigor. First-touch models make content marketing look like a revenue machine. Last-touch models make conversion-stage programs look indispensable. Neither reflects reality. The goal is accurate budget allocation, not flattering reporting.
Mistake 3: Applying One Model Across All Campaign Types
A brand awareness campaign and a bottom-of-funnel retargeting campaign have different objectives and should be measured with different attribution lenses. Using last-touch to evaluate an awareness campaign will always produce misleading results because awareness campaigns are not designed to be the last touch.
Mistake 4: Ignoring the Attribution Window
An attribution window defines how far back in time you look for contributing touchpoints. A 30-day window on a 9-month sales cycle will miss the majority of influence. B2B organizations should set attribution windows of at least 90 to 180 days to capture the full buyer journey.
Mistake 5: Skipping Offline and Dark Social Touchpoints
Word-of-mouth referrals, podcast listens, LinkedIn organic posts, and in-person events rarely appear in attribution data because they are difficult to track with UTM parameters and pixel-based systems. Companies that ignore dark social systematically under-credit the channels that drive the most high-intent inbound leads.
Expert Tips for Building a Reliable Attribution Framework
Tip 1: Start with a clean data foundation
Attribution accuracy is entirely dependent on data quality. Before selecting a model, audit your UTM consistency, CRM integration completeness, and conversion event definitions. A sophisticated algorithmic model built on dirty data produces worse decisions than a simple linear model built on clean data.
Tip 2: Use multiple models simultaneously
The most mature marketing organizations do not pick one attribution model and commit to it exclusively. They use first-touch to evaluate channel discovery efficiency, W-shaped to measure pipeline contribution, and algorithmic attribution to validate budget allocation decisions. Each model answers a different question.
Tip 3: Connect attribution to closed-won revenue, not just MQL
Most attribution implementations stop at lead creation. Full-funnel attribution requires connecting marketing touchpoints all the way to closed-won revenue, which demands a tight integration between your marketing automation platform and CRM. Without this connection, you are measuring marketing’s contribution to lead generation – not revenue generation.
Tip 4: Set a minimum data threshold before using algorithmic attribution
Algorithmic models require statistical significance to produce reliable outputs. Below 1,000 monthly conversions, the variance in algorithmic attribution outputs is too high to inform budget decisions confidently. Use rule-based models until your data volume supports the switch.
Tip 5: Run attribution model comparisons quarterly
Buyer behavior changes. Channel mix evolves. Attribution models that were well-calibrated 12 months ago may no longer reflect how your buyers actually find and evaluate you. Quarterly model audits ensure your budget allocation logic stays current.
Step-by-Step: How to Implement Full-Funnel Attribution
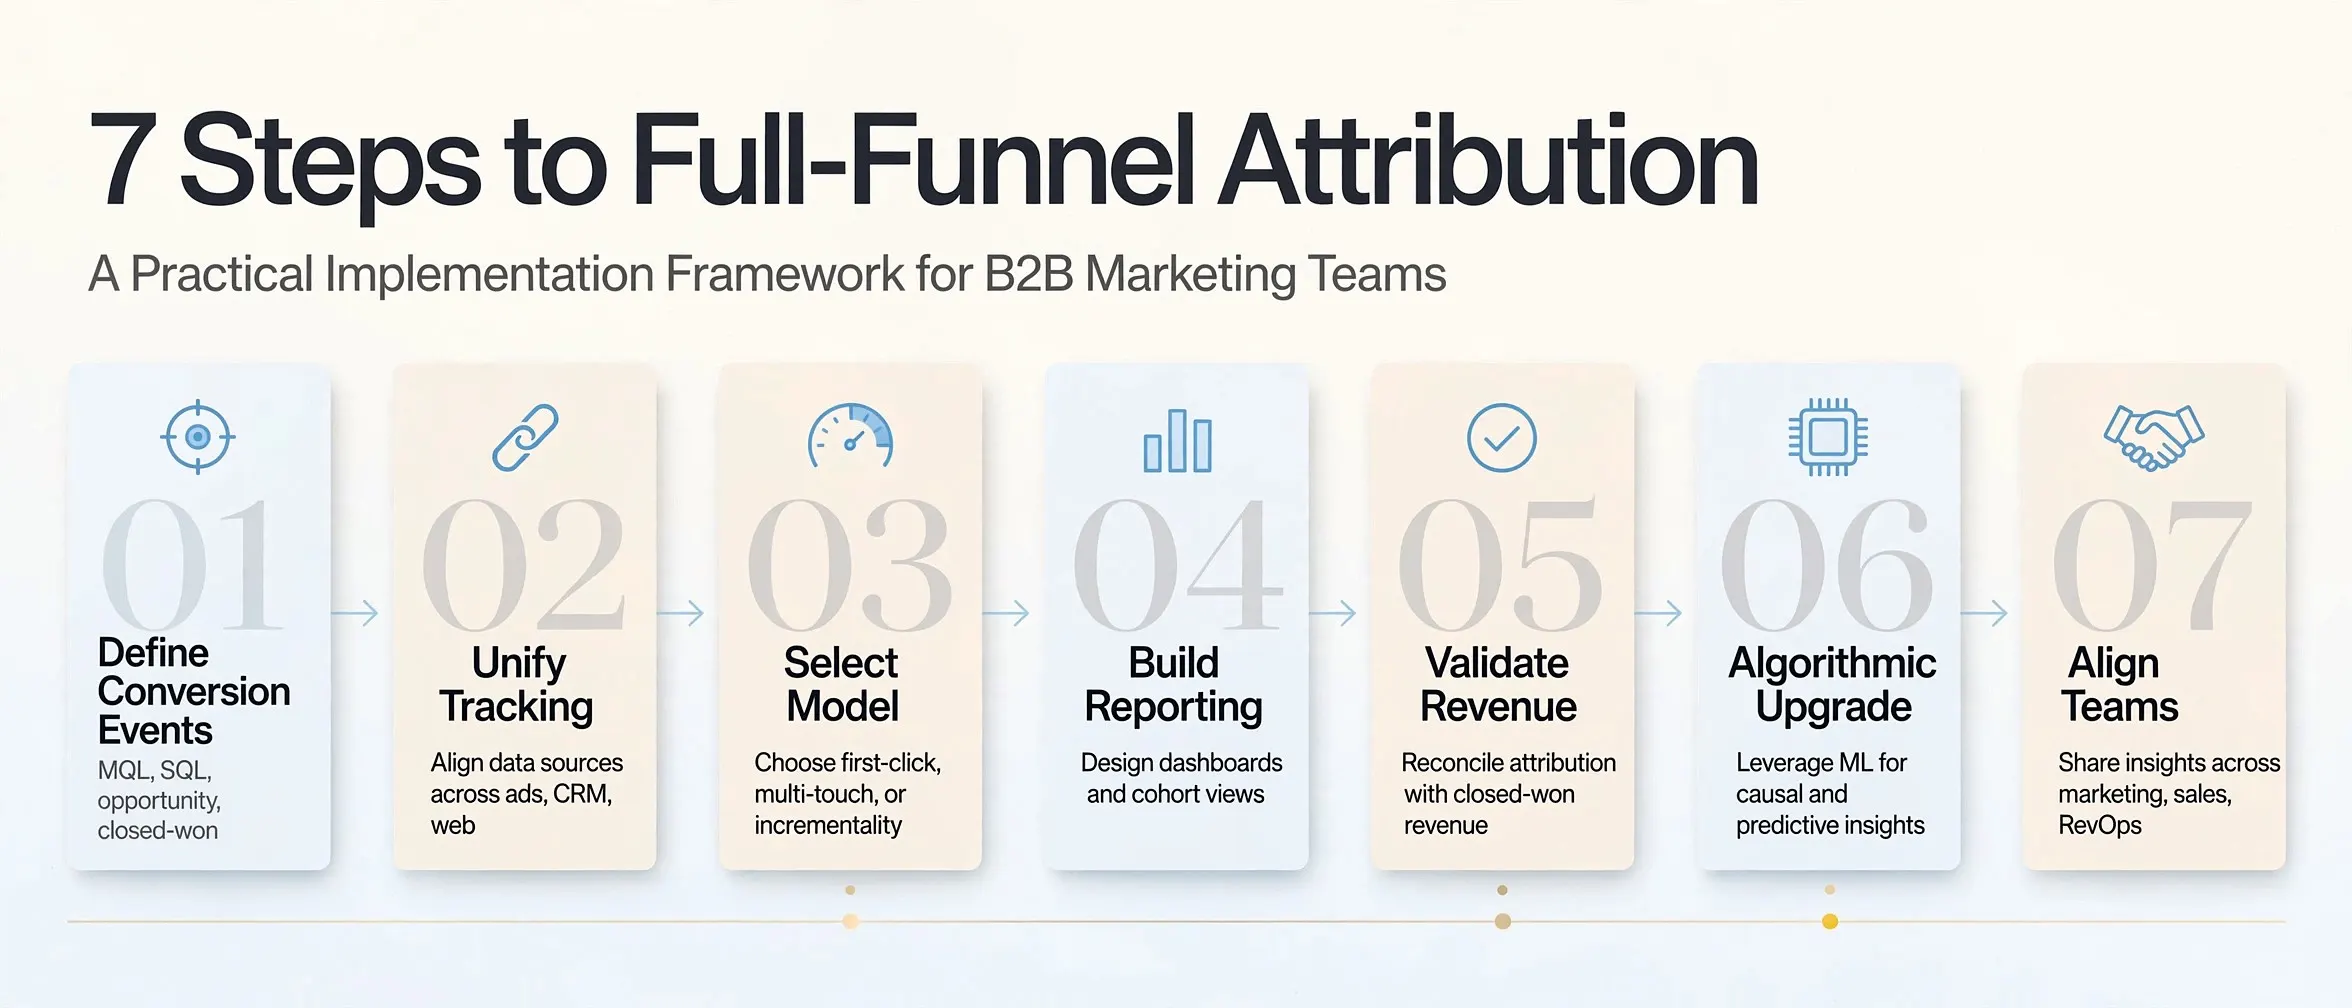
Step 1: Define your conversion events
Identify every milestone in the buyer journey you want to attribute: first visit, content download, MQL, SQL, opportunity creation, closed-won. Each event needs a consistent, trackable definition across all systems.
Step 2: Implement unified tracking
Deploy consistent UTM parameters across every paid, organic, and owned channel. Connect your analytics platform (Google Analytics 4, or equivalent) to your CRM (Salesforce, HubSpot, or equivalent). Ensure every lead source is captured at the contact level and persists through the deal lifecycle.
Step 3: Choose your initial attribution model
Based on your sales cycle length and conversion volume, select the most appropriate starting model using the decision framework above. W-shaped is the recommended default for most B2B organizations.
Step 4: Build your attribution reporting layer
Create a reporting view that shows channel performance under your chosen model alongside revenue contribution. Segment by campaign type, funnel stage, and buyer persona where possible.
Step 5: Validate with revenue data
Cross-reference your attribution model outputs against actual closed-won data from your CRM. If the model’s top-attributed channels do not correlate with your highest-revenue cohorts, the model needs recalibration.
Step 6: Graduate to algorithmic attribution when data volume allows
Once your monthly conversion volume and data infrastructure support it, implement a data-driven attribution model. Google Analytics 4’s data-driven attribution is a viable starting point for organizations not yet ready to build a custom ML-based system.
Step 7: Align marketing and sales on attribution definitions
Attribution disputes between marketing and sales teams are inevitable when definitions differ. Establish shared definitions for what counts as a marketing-attributed touchpoint, which conversion events are included, and how offline sales activities are credited.
Full-Funnel Attribution and GA4: What Changed
Google Analytics 4 deprecated all rule-based attribution models (first-click, linear, time-decay, position-based) from its conversion reporting in 2023 and now defaults to data-driven attribution for all properties with sufficient conversion volume. For properties without enough data, it falls back to last-click.
What this means for marketers:
- GA4’s default reporting now uses algorithmic attribution – a significant upgrade from Universal Analytics’ last-click default
- The “Advertising” section of GA4 allows comparison across attribution models, which is essential for understanding how model choice affects reported channel performance
- Cross-channel data-driven attribution in GA4 is free and integrates natively with Google Ads, but it only captures touchpoints within Google’s ecosystem – meaning paid social, email, and direct traffic attribution require supplemental tooling
According to Google’s attribution documentation, data-driven attribution uses machine learning to evaluate the actual contribution of each touchpoint based on your specific conversion data, rather than applying a fixed credit rule.
Attribution Model Comparison: B2B vs. B2C Use Cases
| Use Case | Recommended Primary Model | Secondary Model for Validation |
|---|---|---|
| B2B SaaS (6-18 month cycle) | W-Shaped | Algorithmic |
| B2B Professional Services | W-Shaped | Linear |
| B2C E-commerce (short cycle) | Time-Decay | Linear |
| B2C Subscription | U-Shaped | Algorithmic |
| Enterprise SaaS (12+ months) | Algorithmic | W-Shaped |
| DTC with paid social focus | Linear | Time-Decay |
| Lead generation (any) | U-Shaped | First-Touch (for discovery) |
FAQ: Full-Funnel Attribution Models
Q1: What is a full-funnel attribution model?
A full-funnel attribution model is a framework that assigns conversion credit across every marketing touchpoint in the buyer journey – from initial brand awareness through to final purchase or pipeline close – rather than crediting a single interaction. Full-funnel attribution enables more accurate budget allocation and channel performance measurement than single-touch models.
Q2: What is the difference between first-touch and last-touch attribution?
First-touch attribution gives 100% of conversion credit to the channel that introduced the buyer to your brand. Last-touch attribution gives 100% credit to the final interaction before conversion. Both are single-touch models that ignore every other touchpoint in the journey, making them unreliable for full-funnel performance analysis in multi-step buyer journeys.
Q3: Which attribution model is best for B2B marketing?
W-shaped attribution is the most widely recommended model for B2B organizations with 6 to 18-month sales cycles, as it assigns meaningful credit to first touch, lead creation, and opportunity creation. Algorithmic attribution is the most accurate option for organizations with sufficient conversion volume and clean data infrastructure.
Q4: How does algorithmic attribution work?
Algorithmic attribution uses machine learning – typically Shapley value analysis, Markov chain modeling, or logistic regression – to analyze historical conversion data and assign credit dynamically to each touchpoint based on its actual incremental contribution. Unlike rule-based models, it learns from your specific data rather than applying a fixed credit formula.
Q5: Why do different attribution models produce different results from the same data?
Each attribution model applies a different mathematical formula to distribute conversion credit. First-touch concentrates all credit at the beginning of the journey; last-touch concentrates all credit at the end; W-shaped distributes credit across three pipeline milestones; and algorithmic models weight credit based on statistical patterns in your historical data. The underlying touchpoint data is the same – the formula changes the credit distribution entirely.
Q6: Can I use multiple attribution models at the same time?
Yes, and leading marketing organizations do exactly this. Using first-touch for channel discovery analysis, W-shaped for pipeline contribution reporting, and algorithmic attribution for budget optimization decisions provides a multidimensional view of full-funnel performance that no single model can offer alone.
Q7: What data do I need for algorithmic attribution?
Reliable algorithmic attribution requires a minimum of approximately 1,000 monthly conversions for statistical significance, consistent UTM tracking across all channels, a clean integration between your ad platforms, marketing automation system, and CRM, and at least 90 days of historical conversion data.
Q8: How does full-funnel attribution affect budget allocation?
Attribution model choice directly determines which channels receive budget. An organization using last-touch attribution will consistently over-invest in bottom-of-funnel conversion channels (branded search, retargeting) and under-invest in the awareness and nurture programs that generated demand in the first place. Switching to a full-funnel attribution model often reveals that 30% to 50% of budget should be reallocated, according to multi-touch attribution implementation benchmarks.
The Right Attribution Model Changes Everything
Choosing the wrong full-funnel attribution model does not just produce inaccurate reports – it produces the wrong strategy. If your budget allocation is based on first-touch or last-touch data, you are almost certainly defunding the programs that generate the most actual revenue and over-investing in the channels that merely appear at the point of conversion.
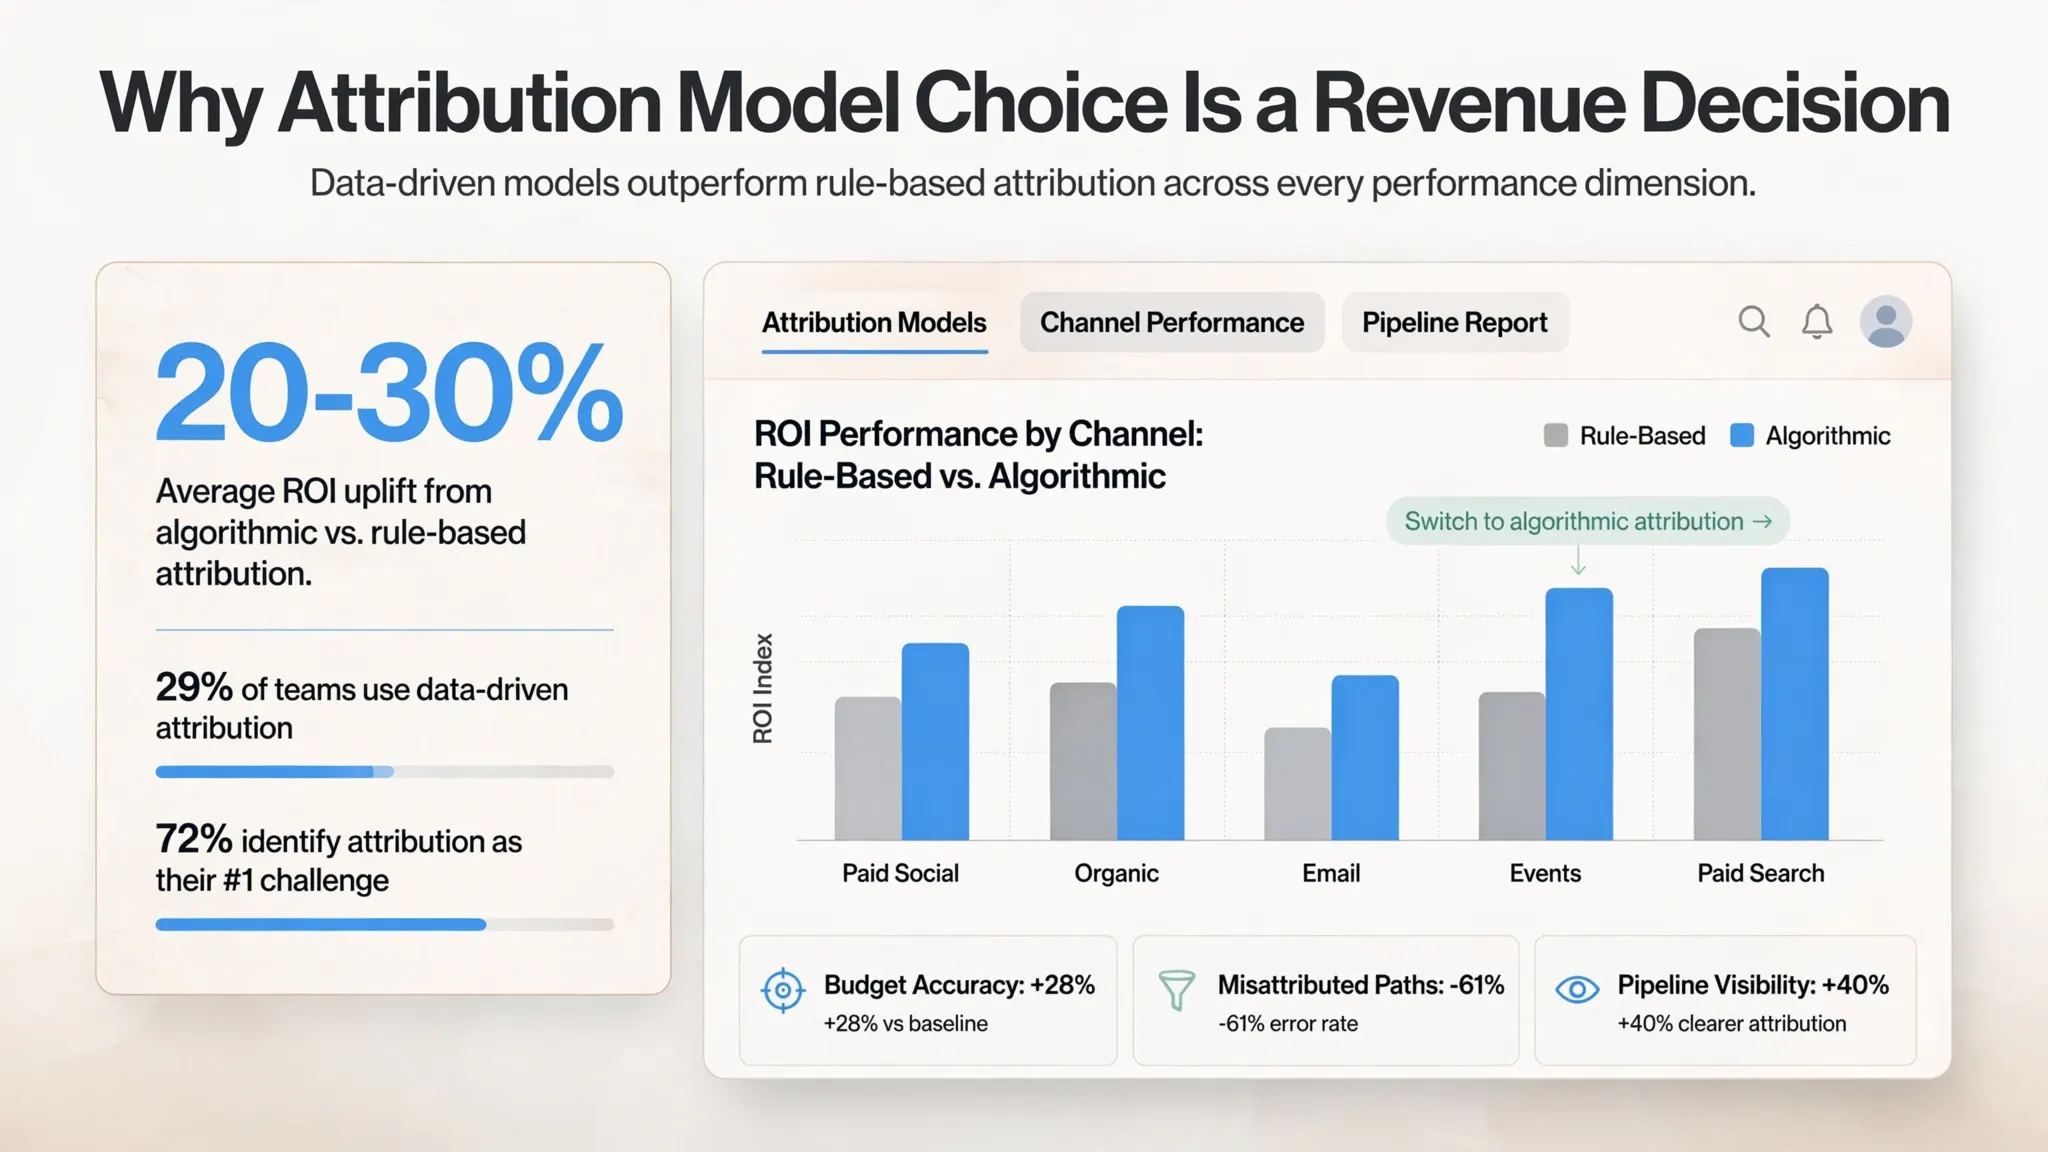
The progression from single-touch to multi-touch to algorithmic attribution mirrors the maturity of your marketing organization. Start with W-shaped attribution as your operational default. Use first-touch to understand channel discovery. Graduate to algorithmic models as your data infrastructure supports it. And never evaluate a brand awareness campaign using last-touch logic.
Key takeaways:
- Single-touch models misattribute over 60% of multi-step buyer journey conversions
- W-shaped attribution is the most practical default model for B2B organizations with 6 to 18-month sales cycles
- Algorithmic attribution improves ROI accuracy by 20% to 30% versus rule-based models – but requires sufficient data volume and infrastructure
- Every attribution model answers a different question; use multiple models simultaneously for a complete picture
- Attribution window length must match your actual sales cycle length or you will miss the majority of influencing touchpoints
Ready to align your attribution framework with actual revenue outcomes? and turn your attribution data into confident budget decisions that drive measurable pipeline growth.