
Full funnel marketing ROI calculation measures the incremental gross profit attributed to every funnel stage, minus the fully loaded marketing cost, divided by that same cost: ROI = (Attributed Incremental Gross Profit – Total Full-Funnel Cost) / Total Full-Funnel Cost × 100. To make the number CFO-ready, you must use gross margin instead of revenue, allocate cost and credit by stage through a multi-touch or data-driven attribution model, validate the result with incrementality testing, and adjust for sales-cycle lag using cohort or lifetime-value windows. The worked examples below apply this formula to a blended quarterly spend of $300,000, then break it into stage-level ROI, CAC payback, and a three-year LTV-adjusted ROI.
Finance teams rarely reject marketing numbers because the math is wrong. They reject them because the inputs are fuzzy. A unified revenue attribution and pipeline analytics framework fixes that problem by tying every dollar of spend to a stage, a cohort, and a gross profit outcome that finance can audit line by line.
Full Funnel Marketing ROI Calculation at a Glance
Here is the quick answer before the deep dive.
- Formula: ROI (%) = (Attributed Incremental Gross Profit – Total Full-Funnel Cost) ÷ Total Full-Funnel Cost × 100
- Numerator: Use gross profit, not revenue, and credit only the incremental share that marketing caused.
- Denominator: Include media, content, people, agency fees, tools, and allocated overhead.
- Attribution: Distribute credit across touchpoints with a multi-touch or data-driven model.
- Validation: Confirm the credit with holdout or geo-lift tests.
- Time window: Match the measurement window to your sales cycle, then add a lifetime view.
Quick steps to run the calculation:
- Define the period and the funnel stages you will measure.
- Total every marketing cost, including people and tools.
- Map each cost to a funnel stage.
- Pull closed-won deals and the touchpoints behind them.
- Apply an attribution model to assign credit.
- Convert attributed revenue into gross profit.
- Apply the ROI formula at blended and stage level.
- Layer on CAC payback, LTV, and incrementality checks.
What Full-Funnel Marketing ROI Actually Measures
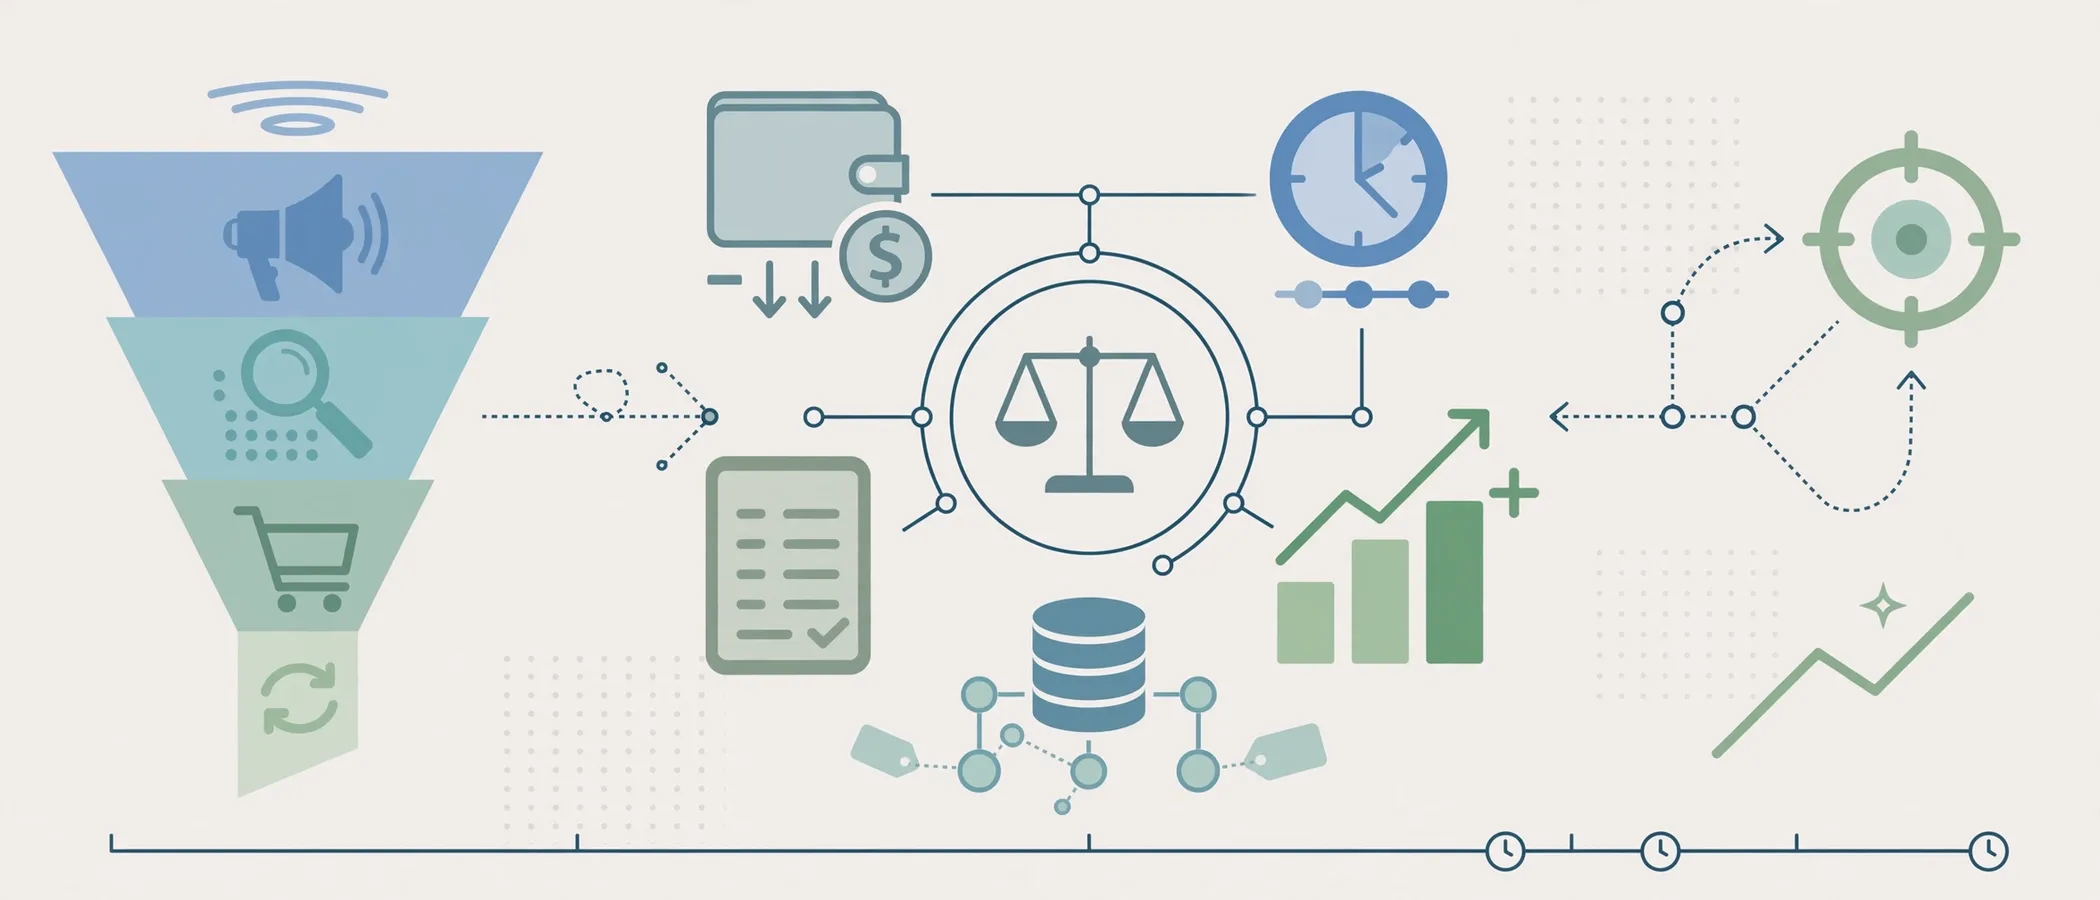
Full-funnel marketing ROI is the net profit return on every dollar spent across awareness, consideration, conversion, and retention. It treats marketing as one connected system instead of a set of isolated channels. If you want a refresher on what a full-funnel approach actually covers, start there, then return to the math.
Most dashboards still report channel-level return. That view is easy to build. However, it hides the real economics.
Why Single-Channel ROI Misleads Finance
A channel report credits the last click and ignores everything that came before it. As a result, branded search and retargeting look heroic, while the video, content, and outbound programs that created the demand look wasteful.
Consider what a single-channel view misses:
- Assisted influence: Top-of-funnel touches that start the buying journey rarely earn last-click credit.
- Shared costs: People, tools, and creative production serve several channels at once.
- Time lag: Spend in one quarter often closes revenue two or three quarters later.
- Cannibalization: Paid clicks sometimes capture buyers who would have converted organically.
Channel ROI vs. Full-Funnel ROI
| Dimension | Channel-Level ROI | Full-Funnel ROI |
|---|---|---|
| Cost base | Media spend only | Media, content, people, tools, overhead |
| Revenue credit | Last click or platform-reported | Multi-touch or data-driven, validated by tests |
| Profit basis | Revenue (ROAS) | Gross profit |
| Time horizon | Same week or month | Cohort or lifetime window |
| Best use | Tactical optimization | Budget decisions and board reporting |
| CFO confidence | Low | High |
Both views matter. Still, only the full-funnel view answers the question finance actually asks: “What do we get back for the total investment?”
The CFO-Ready Full-Funnel ROI Formula

CFOs trust a formula when they can trace each variable to a ledger or a CRM record. Therefore, keep the structure simple and define every term.
Full-Funnel ROI (%) = (Attributed Incremental Gross Profit – Total Full-Funnel Cost) ÷ Total Full-Funnel Cost × 100
Two supporting metrics complete the picture:
- Revenue-to-cost ratio: Attributed revenue ÷ Total full-funnel cost
- CAC payback (months): Customer acquisition cost ÷ Monthly gross profit per customer
For a refresher on the base concept, the definition of return on investment explains why the ratio compares net gain against the cost of the investment.
Component 1: Total Full-Funnel Cost
Count every cost that exists because marketing exists. Otherwise, the ROI looks better than reality and finance will notice.
Include these categories:
- Paid media: Search, social, video, programmatic, and sponsorships
- Content and creative: Writers, designers, video production, and freelancers
- People: Salaries, benefits, and agency retainers
- Technology: CRM, marketing automation, analytics, and attribution tools
- Events and programs: Webinars, trade shows, and field marketing
- Allocated overhead: A fair share of management time and shared services
If you are choosing the measurement stack, this guide to the right measurement tools helps you decide what belongs in the cost base and what delivers the data.
Component 2: Attributed Incremental Gross Profit
This is the harder half of the formula. Three rules keep it defensible.
- Use gross profit. Multiply attributed revenue by gross margin. Revenue ignores the cost of delivering the product.
- Credit only incremental outcomes. Remove sales that would have happened anyway, such as renewals driven purely by contract terms.
- Split credit with sales. Marketing rarely closes alone. Define the sourced and influenced rules in writing before you calculate.
Component 3: The Time Window
Match the window to your sales cycle. A business with a 60-day cycle can use a quarterly window. In contrast, a business with a nine-month cycle should measure cohorts, which this article covers in Worked Example 3.
Step-by-Step Full Funnel Marketing ROI Calculation
Follow these eight steps in order. Each one produces an input for the next.

- Set the scope and period. Choose a quarter, a campaign, or a cohort. State the stages you will measure: awareness, consideration, conversion, and retention.
- Build the cost ledger. Pull actuals from finance, not budgets. Include people and tools, then allocate shared costs by a clear rule such as headcount time or spend share.
- Map costs to stages. Assign each cost line to the stage it primarily serves. Document the rule so the allocation stays repeatable.
- Collect outcomes from the CRM. Export closed-won deals, deal values, close dates, and every recorded touchpoint.
- Select an attribution model. Decide how credit flows across touchpoints. The next section compares your options.
- Convert revenue to gross profit. Multiply attributed revenue by your gross margin percentage.
- Apply the formula. Calculate blended ROI first, then calculate ROI for each stage.
- Stress-test the result. Run holdout or geo tests, then compare the answer against payback and lifetime value.
Worked Example 1: Blended Full Funnel Marketing ROI Calculation

Let’s apply the formula to a B2B software company over one quarter. All figures are illustrative so you can swap in your own numbers.
Step A: Total Full-Funnel Cost
| Cost Category | Quarterly Spend |
|---|---|
| Paid media | $120,000 |
| Content and creative | $45,000 |
| Marketing team and agency fees | $90,000 |
| Technology stack | $25,000 |
| Events and other programs | $20,000 |
| Total full-funnel cost | $300,000 |
Step B: Attributed Revenue
Assume the average first-year contract value (ACV) is $30,000.
- Marketing-sourced deals: 14 deals × $30,000 = $420,000
- Marketing-influenced deals: 10 deals × $30,000 = $300,000; marketing earns 30% credit under the agreed model = $90,000
- Total attributed revenue: $420,000 + $90,000 = $510,000
Step C: Convert to Gross Profit
With a 75% gross margin, attributed gross profit equals $510,000 × 0.75 = $382,500.
Step D: Apply the Formula
- Net return = $382,500 – $300,000 = $82,500
- ROI = $82,500 ÷ $300,000 × 100 = 27.5%
- Revenue-to-cost ratio = $510,000 ÷ $300,000 = 1.70x
How to Read the Result
A 27.5% first-year ROI means every dollar invested returned $1.275 in gross profit within the first contract year. That is a healthy start, yet it ignores renewals and expansion. Example 3 adds that lifetime view.
Worked Example 2: Stage-Level Full-Funnel ROI
A blended number hides the story. For that reason, split cost and credit by stage and look at each one separately.
Using the same $300,000 and $382,500, allocate costs and credit as follows:
| Funnel Stage | Cost | Credit Share | Attributed Gross Profit | Stage ROI |
|---|---|---|---|---|
| Awareness | $105,000 | 20% | $76,500 | -27.1% |
| Consideration | $85,000 | 30% | $114,750 | 35.0% |
| Conversion | $75,000 | 35% | $133,875 | 78.5% |
| Retention and expansion | $35,000 | 15% | $57,375 | 63.9% |
| Blended | $300,000 | 100% | $382,500 | 27.5% |
What the Stage Table Reveals
At first glance, awareness looks like a money-loser at -27.1%. However, that reading misses the mechanics:
- Awareness feeds every later stage. Cut it, and consideration and conversion ROI erode within a few quarters.
- Early-stage returns arrive late. A one-year window undercounts the lifetime value of buyers who enter the funnel today.
- Conversion ROI looks strong partly because it harvests demand. The earlier stages created that demand.
Treat the stage view as a diagnostic tool, not a verdict. Stage ROI shows where to investigate. It does not tell you where to cut.
If your awareness spend underperforms, review your demand generation programs that build pipeline before you cut budget. Fixing targeting or message-market fit often beats reducing spend.
Worked Example 3: Lag-Adjusted and Lifetime ROI
Long sales cycles distort quarterly math. In practice, you spend in Q1 and book revenue in Q2 and Q3. Cohort tracking solves the timing problem.
Cohort Payback View
Assume the $300,000 Q1 spend produces $510,000 of first-year contract value. The deals land across four quarters. Gross margin stays at 75%.
| Quarter | Share of Contract Value Landing | Gross Profit Landing | Cumulative Gross Profit | Cumulative ROI |
|---|---|---|---|---|
| Q1 | 10% | $38,250 | $38,250 | -87.3% |
| Q2 | 45% | $172,125 | $210,375 | -29.9% |
| Q3 | 35% | $133,875 | $344,250 | 14.8% |
| Q4 | 10% | $38,250 | $382,500 | 27.5% |
The cohort breaks even during Q3. A quarterly report would have shown a loss in Q1 and Q2, which could have triggered a premature budget cut.
CAC and Payback
First, count customers using the same credit rules: 14 sourced + (10 influenced × 30%) = 17 weighted customers.
- Marketing CAC: $300,000 ÷ 17 = $17,647
- Monthly gross profit per customer: ($30,000 × 0.75) ÷ 12 = $1,875
- CAC payback: $17,647 ÷ $1,875 = 9.4 months
Note that this CAC covers marketing cost only. If you add sales compensation, you will get a fully loaded CAC. Finance will often ask for both.
Three-Year Lifetime ROI
Now add retention. Assume 85% of customers renew each year, and gross profit stays flat per surviving customer.
- Year 1 gross profit per customer: $22,500
- Year 2: $22,500 × 0.85 = $19,125
- Year 3: $22,500 × 0.85² = $16,256
- Three-year gross profit per customer: about $57,881
Multiply by 17 customers and you get roughly $983,981 of three-year gross profit.
- Three-year ROI: ($983,981 – $300,000) ÷ $300,000 × 100 = 228.0%
This view turns a modest 27.5% first-year return into a 228% lifetime return. If your finance team prefers present-value math, discount each year’s gross profit by your cost of capital before summing.
Choosing the Attribution Model Behind Your Full-Funnel ROI Calculation
The credit rule you choose changes the answer. Therefore, document it, defend it, and apply it consistently.
| Model | How It Assigns Credit | Strength | Weakness |
|---|---|---|---|
| First touch | 100% to the first interaction | Highlights demand creation | Ignores nurture and closing |
| Last touch | 100% to the final interaction | Simple and common | Overrewards bottom-funnel channels |
| Linear | Equal credit to every touch | Easy to explain | Treats all touches as equal |
| Position-based | Heavier weight on first and last touches | Balanced story | Weights are arbitrary |
| Data-driven | Credit based on measured impact on conversion | Learns from your data | Needs volume and a clear audit trail |
| Incrementality testing | Credit based on controlled lift | Closest to causality | Requires test design and time |
Platform rules change over time. For example, Google states that data-driven attribution distributes credit using your own property data and uses path data from both converting and non-converting users. In addition, the Analytics Help Center notes that several rules-based models, including first click, linear, time decay, and position-based, are no longer available in GA4 reporting.
For deeper side-by-side numbers, see how different attribution models distribute credit using real data.
A Practical Rule for Picking a Model
- Under roughly 100 conversions per quarter: Use a position-based or linear model, and lean on incrementality tests for validation.
- High volume with clean tracking: Use a data-driven model, then validate it quarterly.
- Long, offline-heavy cycles: Use CRM-based multi-touch credit and cohort tracking.
Proving Causality With Incrementality Testing
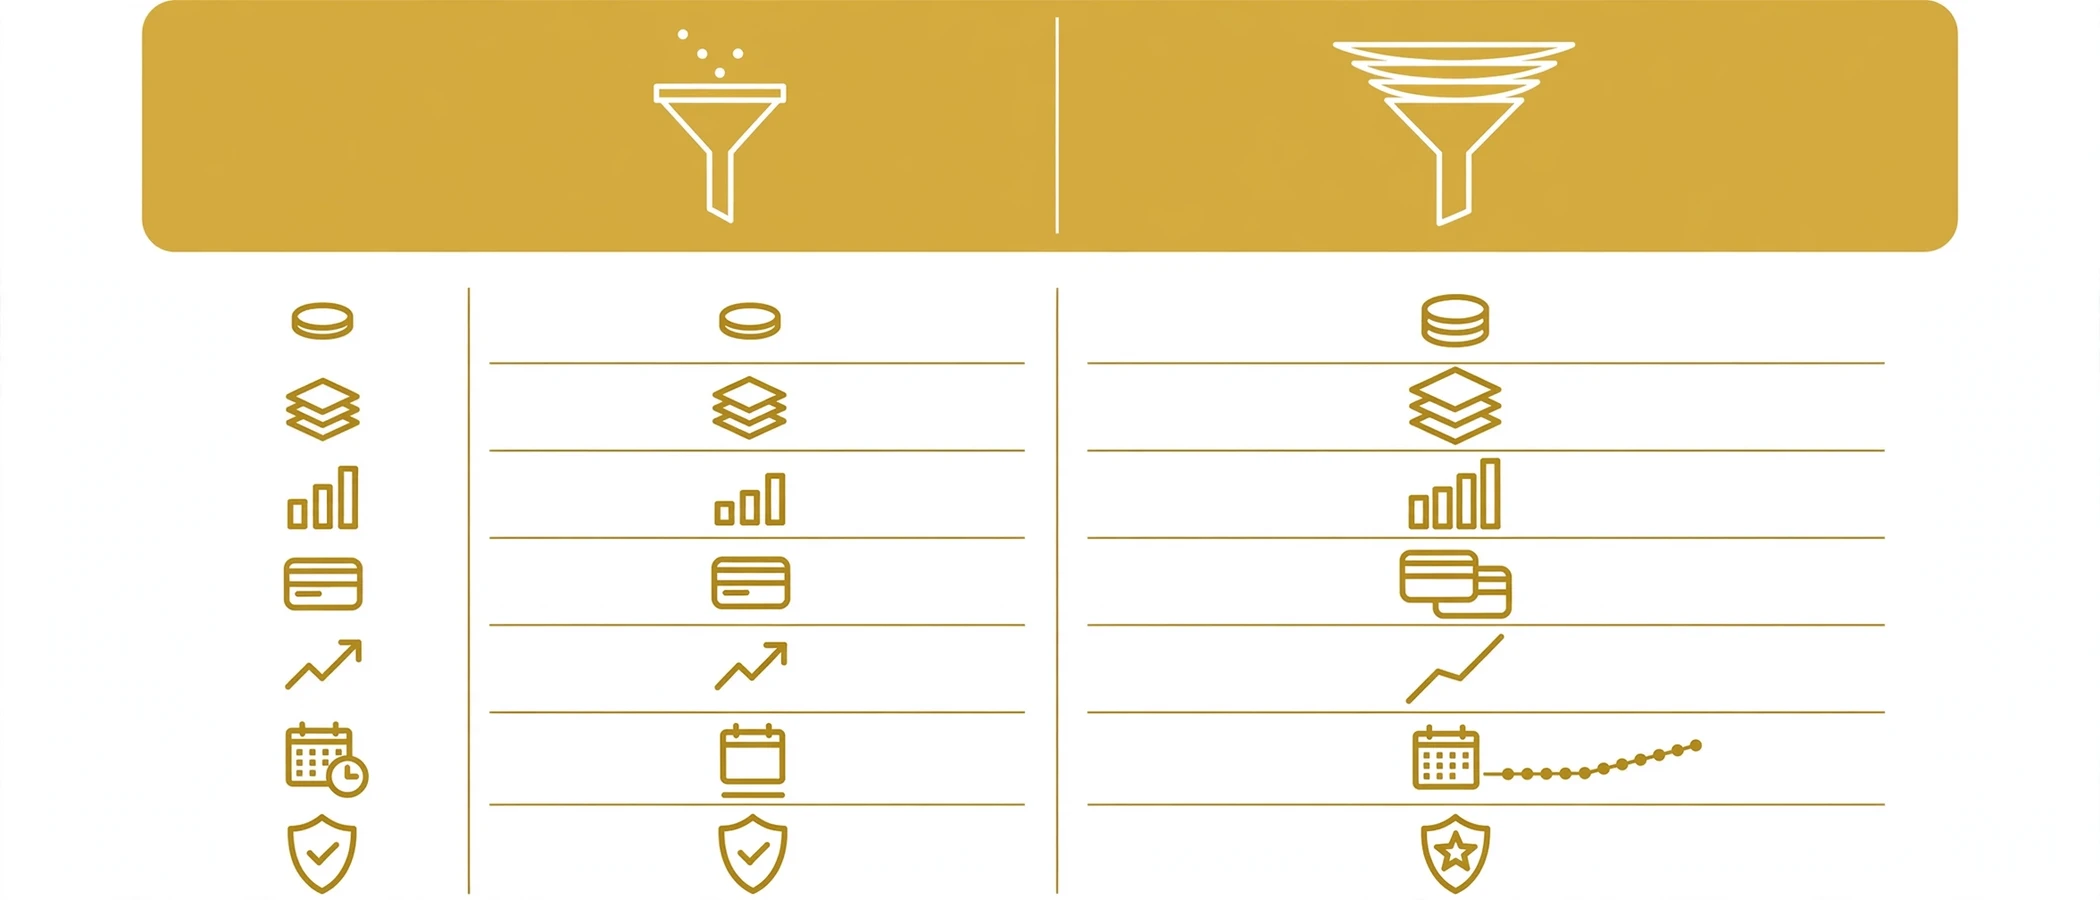
Attribution distributes credit. Incrementality proves the credit was earned. Together, they make a full funnel marketing ROI calculation credible to skeptical finance leaders.
Use these test designs:
- Holdout test: Withhold a campaign from a random audience, then compare conversions against the exposed group.
- Geo-lift test: Pause or boost spend in matched regions and measure the difference.
- Time-based test: Switch a channel off for a controlled window and compare against a baseline.
Example: Adjusting Credit With a Holdout
Suppose retargeting reports $90,000 of attributed revenue. A holdout test shows that 60% of those conversions would have happened anyway. Incremental revenue equals $90,000 × 0.40 = $36,000. Update the numerator with the incremental number, not the reported one.
This single adjustment often separates a number finance accepts from one it questions.
Common Mistakes in Full Funnel Marketing ROI Calculation
Avoid these errors, because each one inflates or distorts the result.
- Using revenue instead of gross profit. This overstates return by ignoring delivery costs.
- Leaving out people and tools. Media-only cost makes ROI look better than it is.
- Crediting everything to the last click. This starves the stages that create demand.
- Ignoring sales-cycle lag. A short window punishes long-cycle investments.
- Double counting. Marketing and sales both claim the same deal in different reports.
- Changing the rules after seeing results. This destroys trust faster than a low number does.
- Skipping validation. Without holdouts or geo tests, credit stays an assumption.
- Reporting one blended number only. Stage detail shows where to act.
Expert Tips for a Board-Ready ROI Report
These practices make your numbers easier to defend.
- Align definitions with finance first. Agree on gross margin, sourced versus influenced, and cost allocation before you build the model.
- Show ranges, not false precision. Present a conservative and an expected case so leaders see the uncertainty.
- Pair ROI with payback and LTV:CAC. Many teams cite a 3:1 LTV-to-CAC ratio as a common planning benchmark; compare against your own margin and cash constraints rather than treating it as a law.
- Keep one source of truth. Pull outcomes from the CRM and costs from the general ledger.
- Report on a fixed cadence. Monthly operating views and quarterly cohort reviews work well together.
- Document every assumption. Include margin, credit rules, retention, and time windows in an appendix.
- Tie metrics to decisions. Show which budget move each number supports.
If you are rebuilding your paid plan around these numbers, a paid media plan that spans every stage helps convert the ROI findings into allocation changes.
Also, review how customer acquisition cost is defined before you present it. A clear customer acquisition cost definition keeps your numerator and denominator consistent with what finance expects.
Decision Rules That Turn ROI Into Action
| Signal | Suggested Action |
|---|---|
| Blended ROI above your hurdle rate and payback under 12 months | Scale the program gradually |
| Strong lifetime ROI but weak first-year ROI | Protect budget and report cohort results |
| Weak stage ROI with healthy upstream volume | Fix conversion, offer, or sales handoff |
| Reported ROI far above incremental ROI | Reduce spend on the over-credited channel |
| High ROI but low volume | Test expansion into adjacent audiences |
Frequently Asked Questions About Full Funnel Marketing ROI Calculation
What is the formula for full funnel marketing ROI calculation?
The formula is ROI (%) = (Attributed Incremental Gross Profit – Total Full-Funnel Cost) ÷ Total Full-Funnel Cost × 100. Use gross profit instead of revenue, include every marketing cost, and credit only incremental outcomes.
Why should I use gross profit instead of revenue?
Revenue ignores the cost of delivering your product or service. Gross profit shows what remains to fund growth, which makes the result comparable to other business investments that finance evaluates.
How long should the measurement window be?
Match the window to your sales cycle. Short cycles can use a quarterly view, while longer cycles need cohort tracking and a lifetime view so that late-closing deals still count.
Which attribution model is best for ROI reporting?
No single model wins everywhere. Data-driven models work well when you have enough conversion volume and clean tracking, and position-based or linear models suit lower volume. In every case, validate credit with incrementality tests.
What is a good full-funnel marketing ROI?
A good ROI clears your company’s hurdle rate and pays back within a window your cash position supports. Pair the percentage with CAC payback and LTV:CAC, since a modest first-year ROI can still produce a strong lifetime return.
How do I include brand and awareness spend?
Include awareness cost in the denominator and credit it through multi-touch attribution or lift testing. Then review it at stage level over a longer window, because its returns usually arrive after the first reporting period.
Conclusion: Make Your Full Funnel Marketing ROI Calculation Finance-Proof
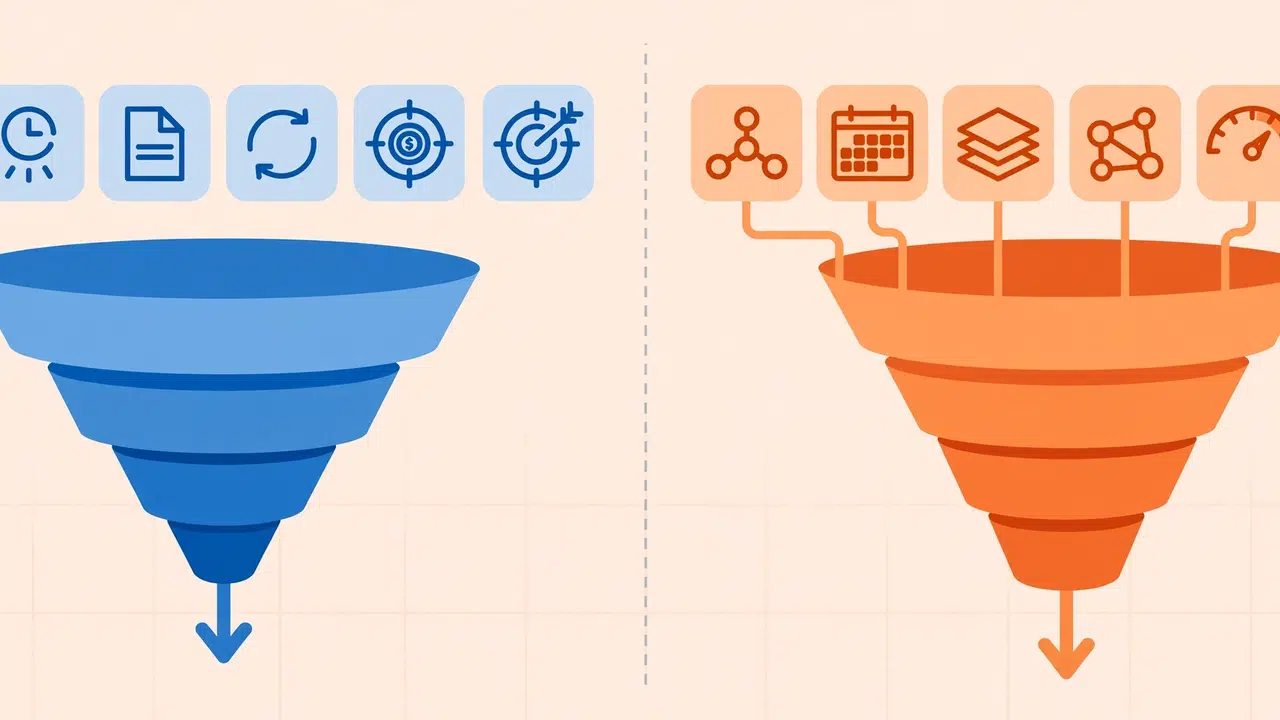
A defensible full funnel marketing ROI calculation rests on five habits: load every cost, credit only incremental gross profit, assign credit with a documented model, validate with controlled tests, and read the result by stage and by cohort. Apply those habits, and the conversation with your CFO shifts from “Can we trust this?” to “Where should we invest next?”
Start with the three worked examples above, swap in your own costs and margins, and set a quarterly review rhythm. Then, when you are ready to turn your marketing spend into a board-ready profit story, bring in a team that can build the attribution, cohort, and reporting layers with you.